Software Tools
INCA
INCA1.20a (previous version)
Overview of features:
- Computes and charts codon and amino acid frequencies
- Calculates common indices, such as effective NC, CAI and “codon bias”
- Fully customizable scatter plots – spot trends in codon usage
- Export graphics, or text files for further analysis
- Built-in self organizing map (SOM) for data visualization and clustering
- Codon usage optimizer helps improve heterologous gene expression
- Random nucleotide sequence generator
- Comprehensive user manual and a 15-minute tutorial
available for the Win32 platform; free of charge for academic use
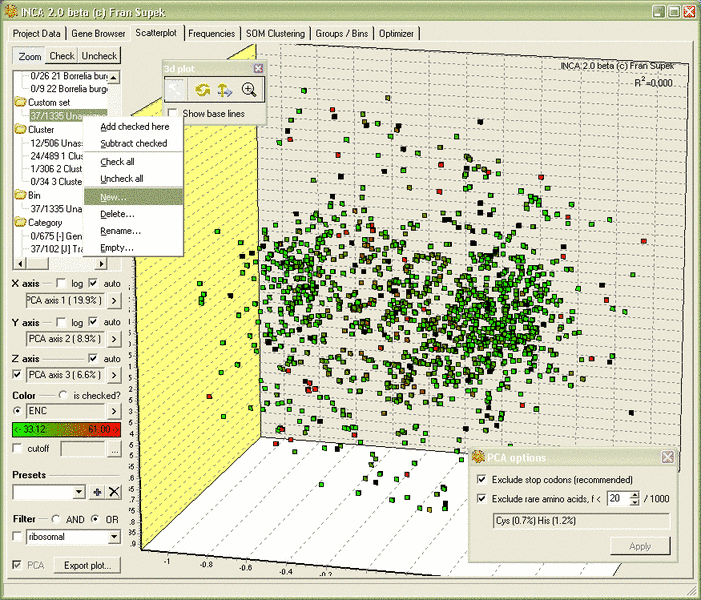
INCA 2.1 with INCAblocks now available!
INCA 2.1 features:
- Ability to load/unload multiple files (ncbi, kegg, cutg, fasta files)
- Save and load ‘projects’, import numerical data and codon frequencies
- Create user-defined gene groups, descriptive stats & correlation for groups
- 3D scatterplots, coloring by any criterion, graphical select & filtering
- Improved SOM, based on the MILC statistic, more vis criteria
- Principal component analysis (PCA) in plots, tables and SOM
- A more comprehensive nucleotide sequence generator
- “INCAblocks 2.1” is the Pascal source code for INCA’s units that enable you to quickly write your own applications
- Numerous user interface improvements; for Windows and Linux
If you used INCA in your work, please cite:
Supek F, Vlahovicek K; INCA: synonymous codon usage analysis and clustering by means of self-organizing map. Bioinformatics. 2004 Sep 22;20(14):2329-2330 link
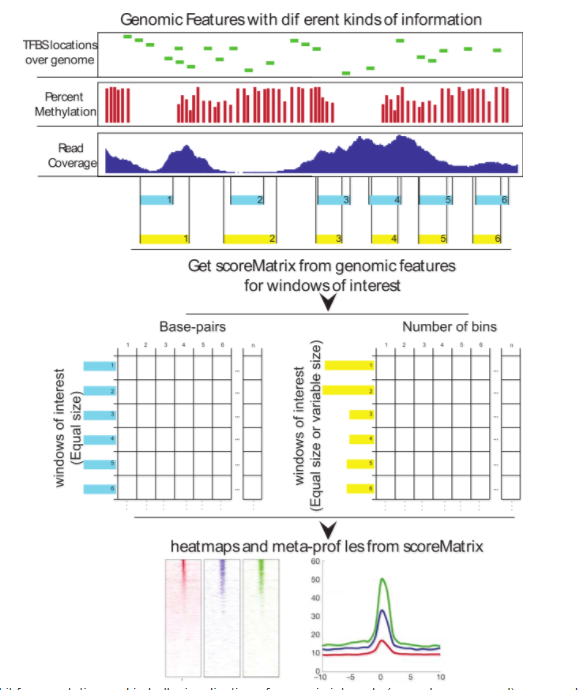
Genomation
Biological insights can be obtained through computational integration of genomics data sets consisting of diverse types of information. The integration is often hampered by a large variety of existing file formats, often containing similar information, and the necessity to use complicated tools to achieve the desired results. We have built an R package, genomation, to expedite the extraction of biological information from high throughput data. The package works with a variety of genomic interval file types and enables easy summarization and annotation of high throughput data sets with given genomic annotations.
MILC and MELP
What are MILC and MELP?
There are a number of methods (also called: measures) currently in use that quantify codon usage in genes. These measures are often influenced by other sequence properties, such as length. This can introduce strong methodological bias into measurements; therefore we attempted to develop a method free from such dependencies.
What did we do?
We compared the performance of several commonly used measures and a novel method we introduce – Measure Independent of Length and Composition (MILC). Large, randomly generated sequence sets were used to test for dependence on:
sequence length
overall amount of codon bias and
codon bias discrepancy in the sequences.
A derivative of the method, named MELP (MILC-based Expression Level Predictor) can be used to quantitatively predict gene expression levels from genomic data. It was compared to other similar predictors by examining their correlation with actual, experimentally obtained mRNA or protein abundances.
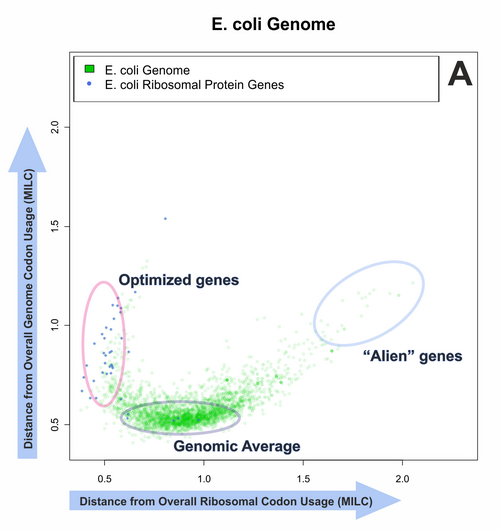
Our conclusion…
We have established that MILC is a generally applicable measure, being resistant to changes in gene length and overall nucleotide composition, and introducing little noise into measurements. Other methods, however, may also be appropriate in certain applications.
Our efforts to quantitatively predict gene expression levels in several prokaryotes and unicellular eukaryotes met with varying levels of success, depending on the experimental dataset and predictor used. Out of all methods, MELP and Rainer Merkl’s GCB method had the most consistent behaviour. A ‘reference set’ containing known ribosomal protein genes appears to be a valid starting point for a codon usage-based expressivity prediction.
This is implemented in the R package coRdon.
Read the whole paper: link
Outdated software
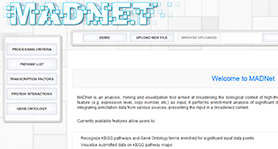
MADNet
MADNet is an analysis, mining and visualization tool aimed at broadening the biological context of high-throughput data. Taking a list of genes with measured biologically relevant feature (e.g. expression level, copy number, etc.) as input, it performs enrichment analysis of significant data points across KEGG pathways and GO terms, while simultaneously integrating annotation data from various sources, presenting the input in a broadened context.
Read the paper: link
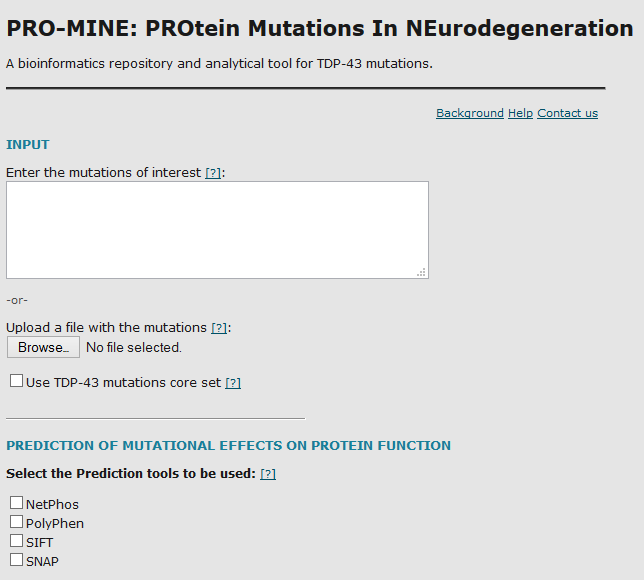
PRO-MINE
PRO-MINE (PROtein Mutations In NEurodegeneration) is a database populated with manually curated data from the literature regarding all TDP-43/TDP43/TARDBP gene disease-associated mutations identified to date. A web server interface has been developed to query the database and to provide tools for the analysis of already reported or novel TDP-43 gene mutations.
Read the paper: link